
Bowtie Analysis is a powerful risk assessment tool that combines elements of fault tree analysis and event tree analysis to provide a clear and visual representation of how hazards can be managed. This methodology is particularly effective in understanding the pathways from potential hazards to unwanted events and identifying critical controls to prevent or mitigate these events. This guide will explore the concept of Bowtie Analysis in detail, covering its history, methodology, applications, benefits, and limitations.
History and Development of Bowtie Analysis
Bowtie Analysis originated in the oil and gas industry in the late 1970s and early 1980s. It gained prominence following major industrial accidents, such as the Piper Alpha disaster in 1988, which highlighted the need for better risk management tools. The methodology was further refined and formalised in the 1990s, becoming a standard practice in high-hazard industries, including aviation, chemical processing, and mining.
Concept of Bowtie Analysis
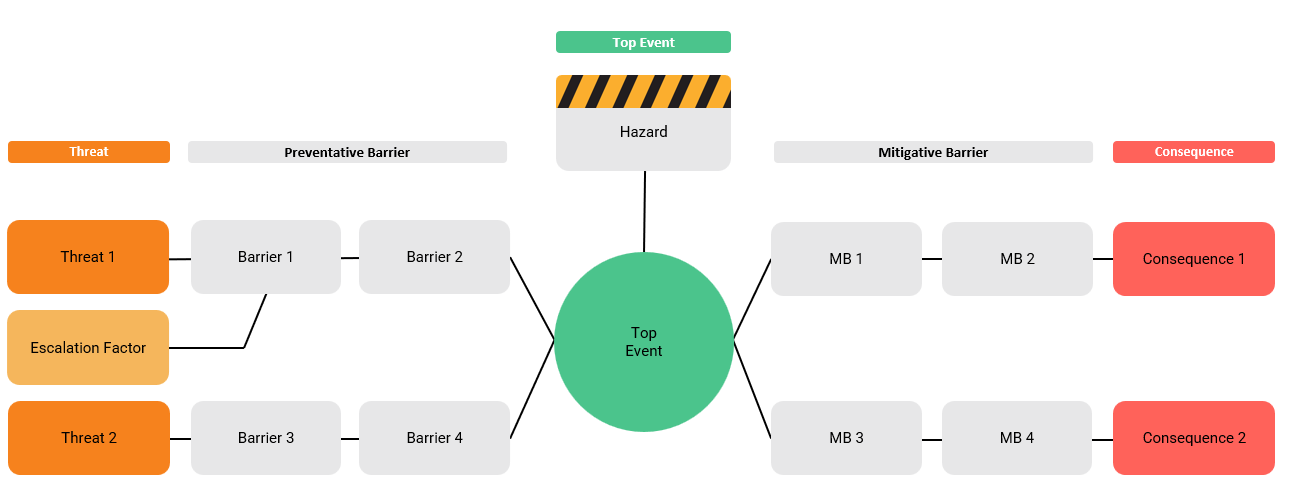
The Bowtie Analysis technique derives its name from the bowtie-shaped diagram used to represent the analysis. This diagram visually depicts the relationship between potential hazards, the causes that can lead to hazardous events, the consequences of those events, and the controls in place to manage both the causes and the consequences.
Components of the Bowtie Diagram
- Hazard: The central point of the bowtie diagram, representing a source of potential harm.
- Top Event: The critical event that occurs when control over the hazard is lost, leading to potential consequences.
- Threats: Factors or conditions that can cause the top event to occur. These are listed on the left side of the diagram.
- Consequences: Potential outcomes or impacts resulting from the top event. These are listed on the right side of the diagram.
- Preventive Controls: Measures implemented to prevent the threats from causing the top event. These controls are placed on lines connecting the threats to the top event.
- Mitigative Controls: Measures implemented to mitigate the consequences of the top event. These controls are placed on lines connecting the top event to the consequences. At this stage it is important to use a high-governance action tracker system to ensure that any mitigating actions are executed in a timely and effective manner.
- Escalation Factors: Conditions that can weaken or disable preventive and mitigative controls.
- Escalation Factor Controls: Measures to manage the escalation factors and maintain the effectiveness of the primary controls.
Methodology of Bowtie Analysis
Bowtie Analysis involves several steps to systematically identify and manage risks:
- Identify the Hazard: Determine the source of potential harm within the system or process.
- Define the Top Event: Clearly describe the critical event that represents the loss of control over the hazard.
- Identify Threats: List all possible threats that could lead to the top event.
- Identify Consequences: List all potential consequences that could result from the top event.
- Identify Preventive Controls: Determine the measures in place to prevent each threat from causing the top event.
- Identify Mitigative Controls: Determine the measures in place to mitigate the consequences if the top event occurs.
- Identify Escalation Factors and Controls: Identify any factors that could weaken the primary controls and the measures to manage these factors.
- Construct the Bowtie Diagram: Create the visual representation of the analysis, ensuring all elements are clearly connected and labelled.
A robust Action Management process can be very useful in ensuring that actions arising are properly assigned, completed and verified.
Applications of Bowtie Analysis
Bowtie Analysis is used across various industries to manage risks associated with complex systems and processes. Some common applications include:
- Oil and Gas: Managing risks related to drilling, production, transportation, and refining operations.
- Aviation: Enhancing safety in flight operations, maintenance, and ground handling.
- Chemical Processing: Controlling risks in the manufacturing, storage, and transportation of hazardous chemicals.
- Mining: Managing safety risks associated with extraction, processing, and transportation of minerals.
- Healthcare: Improving patient safety by identifying and controlling risks in medical procedures and hospital operations.
- Nuclear Power: Ensuring the safe operation of nuclear reactors and the handling of radioactive materials.
Benefits of Bowtie Analysis
Bowtie Analysis offers several advantages that make it a valuable tool for risk management:
- Visual Representation: The bowtie diagram provides a clear and concise visual representation of the risk pathways, making it easier to understand and communicate risks and controls.
- Holistic Approach: By combining elements of fault tree analysis and event tree analysis, Bowtie Analysis offers a comprehensive view of risk management, addressing both prevention and mitigation.
- Engagement and Collaboration: The methodology encourages collaboration among different stakeholders, fostering a shared understanding of risks and controls.
- Focus on Controls: Bowtie Analysis emphasises the identification and management of controls, helping organisations ensure that critical measures are in place and effective.
- Flexibility: The technique can be applied to various types of hazards and industries, making it a versatile tool for risk management.
Limitations of Bowtie Analysis
Despite its many benefits, Bowtie Analysis also has some limitations that should be considered:
- Complexity: For highly complex systems, constructing a comprehensive bowtie diagram can be time-consuming and require significant expertise.
- Static Nature: The bowtie diagram represents a snapshot in time and may not capture dynamic changes in the system or environment.
- Subjectivity: The identification of threats, consequences, and controls can be subjective and may vary depending on the expertise and perspectives of the team involved.
- Maintenance: Keeping the bowtie diagram up to date requires ongoing effort and commitment, particularly in rapidly changing environments.

Case Study: Bowtie Analysis in the Oil and Gas Industry
To illustrate the practical application of Bowtie Analysis, consider its use in managing risks associated with offshore drilling operations in the oil and gas industry.
- Identify the Hazard: The hazard is the presence of hydrocarbons under high pressure in the drilling formation.
- Define the Top Event: The top event is a blowout, which occurs when control over the well is lost, and hydrocarbons are released uncontrollably.
- Identify Threats: Threats include equipment failure, human error, and geological anomalies.
- Identify Consequences: Consequences of a blowout include fire, explosion, environmental pollution, and loss of life.
- Identify Preventive Controls: Preventive controls include blowout preventers, regular maintenance, and rigorous training programs.
- Identify Mitigative Controls: Mitigative controls include emergency response plans, fire suppression systems, and oil spill containment measures.
- Identify Escalation Factors and Controls: Escalation factors include poor maintenance practices and inadequate training. Controls to manage these factors include regular audits and continuous training programs.
- Construct the Bowtie Diagram: The final diagram visually depicts all these elements, showing the pathways from threats to the top event and from the top event to consequences, along with the associated controls.
Integrating Bowtie Analysis with Other Risk Management Tools
Bowtie Analysis can be effectively integrated with other risk management tools to enhance its effectiveness. Some examples include:
- HAZOP (Hazard and Operability Study): Conducting a HAZOP study to identify potential hazards and then using Bowtie Analysis to visualise and manage the associated risks.
- FMEA (Failure Modes and Effects Analysis): Using FMEA to systematically identify potential failure modes and their effects, and then incorporating these findings into a bowtie diagram to ensure comprehensive control measures.
- LOPA (Layer of Protection Analysis): Combining LOPA with Bowtie Analysis to evaluate the effectiveness of different layers of protection and ensure adequate risk reduction.
Conclusion
Bowtie Analysis is a versatile and powerful risk assessment tool that provides a clear and comprehensive view of how hazards can be managed through a combination of preventive and mitigative controls. Its visual nature makes it particularly effective for communicating risks and controls to stakeholders, fostering collaboration and engagement. While it has some limitations, these can be mitigated by integrating Bowtie Analysis with other risk management tools and maintaining a commitment to ongoing monitoring and updating of the analysis.
By understanding and applying Bowtie Analysis, organisations can enhance their ability to identify, assess, and manage risks, ultimately contributing to safer and more reliable operations across a wide range of industries.